The October Political Report
The October Political Report
As our topline voting intent figures show, any post-conference bounce for Labour or any other party has disappeared as the state of the parties is near identical to how it was before the conference season.
Party conference impressions
When asked which party leader performed the best at their conference, 32% chose David Cameron, 20% chose Ed Miliband and 6% chose Nick Clegg. 42% didn?t know
- While 74% of Conservative supporters chose Mr Cameron, only 51% of Labour supporters chose Mr Miliband, 38% of Labour supporters said they didn?t know.
- Among Liberal Democrats, Nick Clegg was chosen by 35% while 37% said they didn?t know.
74% of respondents said David Cameron is either quite likely or very likely to be Conservative leader in 12 months? time, 51% said Ed Miliband will still be Labour leader and 46% said Nick Clegg will still lead the Lib Dems
- Again, Labour supporters were less enthusiastic about Ed Miliband than Conservatives were about Mr Cameron. Only 72% of Labour voters said Mr Miliband will be Labour leader in a year?s time vs. 94% of Conservatives saying the same about Mr Cameron.
- Labour voters reserved most of their gloomy predictions for Nick Clegg with 37% saying he was quite unlikely or very unlikely to be in his job 12 months from now.
Party leader ratings
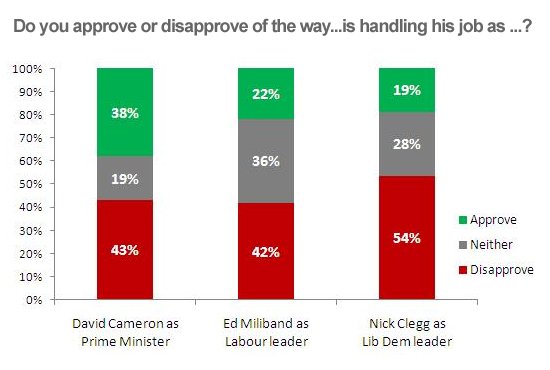
Party leader ratings are relatively unchanged since the last time this question was asked in mid September:
- David Cameron is the most popular leader with a disapproval rating only 6% lower than his approval rating. Almost twice as many respondents disapprove of Ed Miliband?s job performance as approve of it and Nick Clegg remains on -35% job approval with only 19% approving and 54% disapproving.
- Rumours of Conservative discontent with David Cameron appear to be exaggerated as 88% of Conservative voters approve of his performance as Prime Minister. Only 3% disapprove. 41% of Liberal Democrat voters also approve of Mr Cameron?s job performance vs. only 28% who disapprove.
- In contrast, only 51% of Labour voters approve of Ed Miliband?s job performance, 15% disapprove while a sizeable 41% neither approve nor disapprove.
- Nick Clegg is seen positively by both Liberal Democrat and Conservative voters. 50% of Lib Dems approve while 16% disapprove (33% say neither) while 34% of Conservatives approve and 31% disapprove.
Labour voters were uniformly negative with 74% disapproving of Mr Clegg?s performance and only 9% approving.
Government approval
- tOverall approval of the government?s performance remains largely unchanged with 14% more disapproving than approving.
- Unsurprisingly, Conservatives are united behind the government (83% approve) while Labour are unambiguously opposed (79% disapprove).
- Liberal Democrats are more evenly divided, 43% approve and 34% disapprove.
- Those who would vote for another party are largely opposed to the government, 74% disapprove while only14% approve
Government performance on issues
- Government approval is negative for all issues but most negative on unemployment, the economy and health
- In contrast, 40% of Conservatives believe the government is handling unemployment well while 47% of Liberal Democrats say it is being handled badly
- While Conservatives more generally support the Coalition government, only Crime sees more Liberal Democrat support than opposition
Charts:


Opinium Research carried out an online survey of 1,962 GB adults aged 18+ from 7th to 10th October 2011. Results have been weighted to nationally representative criteria.
Interview Method and Sample
This survey is conducted online by CAWI (computer aided web interviewing), using Opinium?s online research panel of circa 45,000 individuals. This research is run from a representative sample of GB adults (aged 18+ in England, Scotland and Wales). The sample is scientifically defined from pre-collected registration data containing gender, age (18-34, 35-54, and 55+), region (North East, North West, Yorkshire and Humberside, East Midlands, West Midlands, East of England, London, South East, South West, Wales, and Scotland), working status and social grade to match the latest published ONS figures.
Opinium also takes into account differential response rates from the different demographic groups, to ensure the sample is representative.


