Political Polling – 25th September
25th September 2012
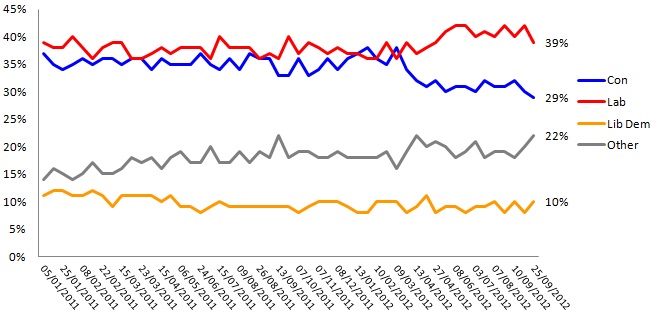
Despite both main parties dipping, Labour still have a double digit lead with 39% to 29% for the Conservatives. This is the first time Opinium have ever shown the Conservatives dipping below 30%.
The Liberal Democrats and UKIP are both on 10% with UKIP actually on 10.45% vs. 9.88% for the Lib Dems.
- David Cameron’s net approval rating is -17% with 33% approving and 50% who disapprove. This is level with Labour leader Ed Miliband of whom 23% approve while 40% disapprove
- 15% of likely voters approve of Nick Clegg in the wake of his party conference while 61% disapprove making his net rating -46%
This week’s questions for the Observer focused on Ed Miliband and the Labour party as their conference beings in Manchester.
- Despite Labour’s consistent lead in the voting intention polls, David Cameron is still clearly the most preferred Prime Minister with 29% saying he would be the best PM vs. just 17% for Ed Miliband and 5% for Nick Clegg. Although an incumbent PM should normally do better on this question than a leader of the opposition, the Labour leader should be concerned that just 47% of Labour supporters chose him while 37% said “none of these”
- Just 28% of likely voters say they can imagine Ed Miliband as Prime Minister while 63% cannot. Among Labour voters these figures are reserved with 63% saying they can but, again, the concerning figure for the Labour leader should be the 29% who can not
As with the Liberal Democrats, we asked respondents three questions about whether they were likely or unlikely to consider voting Labour at the next election (expected in 2015). The first assumes that Ed Miliband is still leader, the second assumes that he has been replaced but does not say by whom while the third assumes that he has been replaced by Ed Balls.
- 33% would consider voting Labour with Ed Miliband as leader while 50% would not. Under an unnamed leader, 36% would consider it while 39% would not and under Ed Balls just 26% would consider doing so while 51% would not
- What this suggests is that while Ed Miliband remains a slight drag on his party’s support, this would not be improved by replacing him with Ed Balls. However, the drop in “unlikely” from 50% under Mr Miliband to 39% under an “unnamed” leader suggests that Mr Miliband remains a barrier to voting Labour for a number of people. However, any replacement would no doubt come with their own flaws and baggage making them objectionable to possibly just as many people
When asked which party leader they most associated with a series of attributes, David Cameron was far ahead on “able to take tough decisions” (40% to Miliband’s 14%), “has a clear vision of where the country should be heading (29% to Miliband’s 18%) and “Capable” (33% to Miliband’s 19%).
- Ed Miliband is further ahead on more empathetic issues such as “in touch with ordinary peoples’ lives” (27% to Cameron’s 12%) and “cares about every sector of society” (22% to Cameron’s 13%)
We also asked a series of questions on the economy and which “economic team” likely voters trust to handle it.
- 26% chose David Cameron and George Osborne while 24% chose Ed Miliband and Ed Balls. Although the Conservatives are only slightly ahead, this is bad news for Labour given that 72% of respondents rated the state of economy as either “quite bad” or “very bad” while only 7% rated it as good
- When asked who they held responsible for the current state of the economy, 29% chose the current coalition government while 46% chose the last Labour government
- Despite this, more respondents believe that the government should spend more money to stimulate the economy even if it means borrowing more in the short term (44%) than believe the government should continue to focus on reducing the deficit by cutting public spending (30%)
Topline Voting Intention
| † | % | Change |
| Conservative | 29 | -1 |
| Labour | 39 | -3 |
| Liberal Democrats | 10 | +2 |
| Other parties | 22 | +2 |
Other Parties (breakdown)
| † | % | Change |
| UKIP | 10 | n/c |
| Green | 4 | n/c |
| SNP | 3 | n/c |
| BNP | 2 | n/c |
| Plaid Cymru | 1 | +1 |
| Other | 2 | +1 |
Approval ratings
| † | % Approve | % Disapprove | Net rating | Net rating (own party) |
| David Cameron | 33% | 50% | -17% | +77% |
| Ed Miliband | 23% | 40% | -17% | +37% |
| Nick Clegg | 15% | 61% | -46% | +39% |

Opinium Research carried out an online survey of 1,969 GB adults aged 18+ from 18th to 21st September 2012. Results have been weighted to nationally representative criteria.
Interview Method and Sample
This survey is conducted online by CAWI (computer aided web interviewing), using Opinium?s online research panel of circa 30,000 individuals. This research is run from a representative sample of GB adults (aged 18+ in England, Scotland and Wales). The sample is scientifically defined from pre-collected registration data containing gender, age (18-34, 35-54, and 55+), region (North East, North West, Yorkshire and Humberside, East Midlands, West Midlands, East of England, London, South East, South West, Wales, and Scotland), working status and social grade to match the latest published ONS figures.
Opinium also takes into account differential response rates from the different demographic groups, to ensure the sample is representative.


