Political Polling – 19th February 2013
19th February 2013
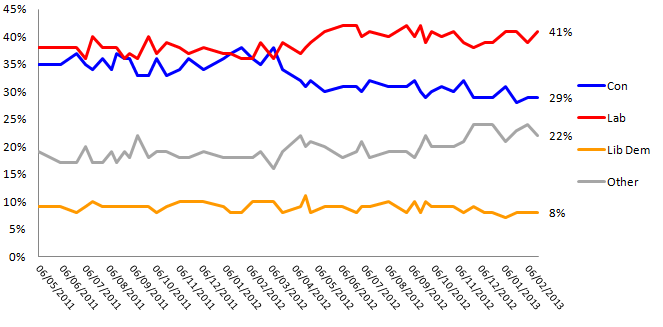
- The Liberal Democrats are unchanged on 8% while UKIP drop a point to 13%
- Labour ‘s share of the vote has now exceeded the combined total for both coalition parties for just under three months with the 27th November poll being the last time the coalition parties had an overall lead
- It has also been just under five months since the Liberal Democrats were in third place
- David Cameron’s net approval rating has improved slightly to -18%, up from -21%. This is due to a slight increase in the number who approve (to 32%) and a slight dip in the number who disapprove (50%)
- Ed Miliband?s net approval rating has also improved keeping him ahead of the Prime Minister. 25% approve while 40% disapprove, taking him back to -15% after his drop to -19% in the last poll
- Nick Clegg’s net approval improves slightly to -46% as the number who disapprove drops to 59% from 63%. 13% approve of the Lib Dem leader, down slightly from 14%
This week we asked again about how voters view the economy and the results were little changed from when this question was asked last September.
- 71% of likely voters feel that the state of the economy is either quite bad (42%) or very bad (29%) while just 8% feel that it is good. A statistically insignificant change from September with the only real difference being slightly more people saying “very bad” (29% vs. 26%) and fewer saying “quite bad” (42% vs. 46%)
- When asked who they think is most responsible for the current state of the economy, there was a slight shift
- In September, 46% thought that the last Labour government was most responsible for the state of the economy compared to 29% for the current Coalition government. Those number have now narrowed slightly with 43% mentioning the last Labour government and 34% the current Coalition government. This has seen a corresponding drop in the number selecting “none of these”, suggesting that the views on the economy that will inform the next election may be starting to take shape
Topline Voting Intention
| † | % | Change |
| Conservative | 29 | n/c |
| Labour | 41 | +2 |
| Liberal Democrats | 8 | n/c |
| Other parties | 22 | -2 |
Other Parties (breakdown)
| † | % | Change |
| UKIP | 13 | -1 |
| Green | 2 | -2 |
| SNP | 4 | +1 |
| BNP | 2 | n/c |
| Plaid Cymru | 1 | +1 |
| Other | 1 | n/c |
Approval ratings
| † | % Approve | % Disapprove | Net rating | Net rating (own party) |
| David Cameron | 32% | 50% | -18% | +83% |
| Ed Miliband | 25% | 40% | -15% | +41% |
| Nick Clegg | 13% | 59% | -46% | +40% |


Opinium Research carried out an online survey of 1,956 GB adults aged 18+ from 19th to 21st February 2013. Results have been weighted to nationally representative criteria.
Interview Method and Sample
This survey is conducted online by CAWI (computer aided web interviewing), using Opinium?s online research panel of circa 30,000 individuals. This research is run from a representative sample of GB adults (aged 18+ in England, Scotland and Wales). The sample is scientifically defined from pre-collected registration data containing gender, age (18-34, 35-54, and 55+), region (North East, North West, Yorkshire and Humberside, East Midlands, West Midlands, East of England, London, South East, South West, Wales, and Scotland), working status and social grade to match the latest published ONS figures.
Opinium also takes into account differential response rates from the different demographic groups, to ensure the sample is representative.


