Political Polling – 11th December
11th December 2012
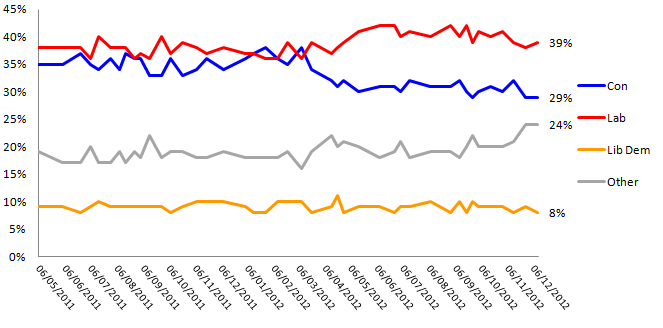
Labour have gained a point putting them on 39% and taking their lead over the Conservatives to 10 points. The Conservatives are on 29% while the Lib Dems languish on 8%.
UKIP have maintained their recent gains with a small rise in support to 14%, up 1 point from last month.
- All three main party leaders have seen their net approval ratings drop this month. David Cameron is down 4 points to -19%, Ed Miliband is down 3 points to -16% and Nick Clegg has fallen 3 points to -46%
- Mr Cameron?s approval rating has fallen by 2 points while his disapproval score has risen by 2 giving him an approval rating of 32% and a disapproval rating of 51%. Ed Miliband is on 25% approval (down 1) and 41% disapproval (up 2) while Nick Clegg has an approval score of just 13% (down 2) and disapproval score of 59% (up 1)
This week we asked about voters attitudes to the living wage and whether knowing that a company paid staff the living wage would make them willing to pay slightly more for goods and services.
- 47% of respondents say they would be prepared to pay more, compared to 37% who say that they would not
- Among likely voters for the three main parties, Liberal Democrat voters were most in favour of the Living Wage ? 57% said they would be prepared to pay more while 26% said that they would not be prepared to pay more
- Among likely Labour voters 53% would be prepared to pay more and 33% would not. Among likely Conservative voters 48% would be prepared to pay more and 41% would not
- Looking at the regions of Great Britain, Scots and Londoners are most likely to be prepared to pay more if it means that companies pay the living wage. 56% of Scots said that they would be prepared to pay more while 25% would not. 55% of Londoners would be prepared to pay more while 29% would not
Topline Voting Intention
| † | % | Change |
| Conservative | 29 | n/c |
| Labour | 39 | +1 |
| Liberal Democrats | 8 | -1 |
| Other parties | 24 | n/c |
Other Parties (breakdown)
| † | % | Change |
| UKIP | 14 | +1 |
| Green | 4 | +1 |
| SNP | 3 | -1 |
| BNP | 2 | n/c |
| Plaid Cymru | 0 | -1 |
| Other | 0 | -1 |
Approval ratings
| † | % Approve | % Disapprove | Net rating | Net rating (own party) |
| David Cameron | 32% | 51% | -19% | +77% |
| Ed Miliband | 26% | 41% | -16% | +44% |
| Nick Clegg | 13% | 59% | -46% | +34% |


Opinium Research carried out an online survey of 1,968 GB adults aged 18+ from 11th to 13th December 2012. Results have been weighted to nationally representative criteria.
Interview Method and Sample
This survey is conducted online by CAWI (computer aided web interviewing), using Opinium?s online research panel of circa 30,000 individuals. This research is run from a representative sample of GB adults (aged 18+ in England, Scotland and Wales). The sample is scientifically defined from pre-collected registration data containing gender, age (18-34, 35-54, and 55+), region (North East, North West, Yorkshire and Humberside, East Midlands, West Midlands, East of England, London, South East, South West, Wales, and Scotland), working status and social grade to match the latest published ONS figures.
Opinium also takes into account differential response rates from the different demographic groups, to ensure the sample is representative.


